by Genevieve Demos Kelley
The 2015 SAT scores for Prince George’s County high schools are now available on the Maryland Report Card. Though the school system’s average math subscore was three points higher this year than last year, 2015 saw a slight decline in both the mean composite SAT score and the number of test takers.
The table below shows the average reading, math, and writing subscores and the average composite SAT scores for 2015 college bound seniors in each of the county’s public high schools, as well as the average scores for PGCPS and the state of Maryland. Next to each score, the change from the previous year, 2014, is displayed in either red or green. For example, in Bladensburg High School, the average reading SAT score was 371 in 2015, 31 points lower than it was in 2014. The average math score was 384, two points higher than in 2014.
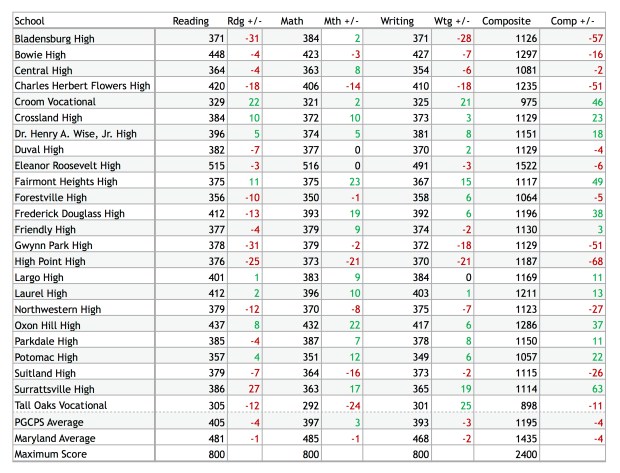
Mean SAT scores for college-bound seniors, as reported by the MSDE on the 2015 Maryland Report Card; changes (+/-) from 2014.
To find SAT scores for your school, for every year from 2008 to 2015, go to the Maryland Report Card and hover over the “School” tab. Choose “Prince George’s County” from the pull-down menu, then find your school. Click to open the SAT pdf file, found under the “Graphs and Tables” heading.
One piece of good news for PGCPS is that the mean ACT scores in the county have been holding steady — and even increasing slightly — since 2008. There was no change between last year and this year in the composite ACT score (18), or in the reading (19) or math (17) subscores. The English and science subscores have each increased by one point since 2014, to 18 and 19, respectively. And more students in Prince George’s County took the ACT this year than in any year since 2008, the earliest year for which data is available on the Maryland Report Card. Still, far more students in Prince George’s County take the SAT. In 2015, 6,630 seniors took the SAT, compared with 1,196 who took the ACT.

One thought on “Slight Decline in Prince George’s SAT Scores for 2015”