Maryland Report Cards: What Should a Parent Know?

by Lori Morrow

On December 3rd, the Maryland State Department of Education released the 2019 Maryland Report Card ratings for all of the public schools in the state.  The Maryland Report Card is the accountability system that aligns with the federal Every Student Succeeds Act (ESSA).

Screen Shot 2019-12-11 at 9.19.39 PM

Here are a few highlights and links to help you understand the ratings and use this information to improve your school:

  1. 2019 is the second year that the Maryland Report Card ratings have been published, however there are additional items added this year, including performance on science tests; school improvement since 2018; and the school survey by students and educators. https://reportcard.msde.maryland.gov/HelpGuides/ReportCard_New_2019_v4a.pdf
  1. Maryland Report Card scores are available for each school at https://reportcard.msde.maryland.gov. In addition, there is an overall Report Card for each county although there is no star rating assigned at the county level.
  1. Each school receives a percent of the total points earned; a percentile ranking compared to other schools; and an overall star rating based on the point percentage. The Report Card breaks down the score by individual lines so that stakeholders can see how various factors impacted the overall score. The MSDE Guide to Understanding Your 2019 Maryland School Report Card goes into greater detail on how to interpret scores at each school level: https://reportcard.msde.maryland.gov/HelpGuides/MSDE_ReportCard_UserGuide_2019_v5.pdf
  1. The Maryland School Survey is worth 15 points of the 35-point School Quality and Student Success indicator. It is administered to all students in grades 5-11 and all educators. https://reportcard.msde.maryland.gov/HelpGuides/ReportCard_School_Survey_2019_v4.pdf
  1. Maryland Comprehensive Assessment Program (MCAP) scores are incorporated into the Report Card in the Academic Achievement and Academic Progress components. Spring 2019 was the last year that Maryland administered the PARCC test for Math and English Language Arts (ELA), and the state is currently in the process of developing new tests that will take less time than the previous PARCC tests. View the October 2019 MCAP Update here: http://www.marylandpublicschools.org/stateboard/Documents/10222019/TabF-MdComprehensiveAssessmentProgram.pdf
  1. Want to hear more directly from MSDE? The slides and video of the presentation at the State Board of Education are available online. This portion of the meeting starts around the 42-minute mark. http://www.marylandpublicschools.org/stateboard/Pages/meeting-agendas/2019/2019-12-03.aspx

Continue reading

Student Learning Objectives: Making Sense of SLOs

by Natalie Barnes

Teacher Evaluation 2018-2019.png

What are SLOs?

In accordance with grant programs such as Race to the Top, states are developing teacher evaluation systems to determine teacher-effectiveness. Students’ standardized test scores are often used to measure teacher effectiveness. However, standardized test scores are not “available or appropriate for all teachers and subjects,” according to a document put out by the U.S. Department of Education describing how states use student learning objectives in teacher evaluation systems. States can choose their own ways to evaluate teachers and Maryland has chosen to use Student Learning Objectives (SLOs) as part of their evaluation.

According to the Prince George’s County Public Schools Student Learning Objective Handbook, the state of Maryland has defined a Student Learning Objective (SLO) as “A specific, rigorous, long-term goal for groups of students that educators create to guide their instruction and administrative efforts.” The handbook continues, stating “Although SLOs contribute to the Student Growth component of the overall evaluation in Prince George’s County Public Schools, they are best utilized as an instructional tool. SLOs are a meaningful approach to measuring student learning because they enable teachers to determine the focus of instruction and how student learning will be measured. SLOs are not an “additional” task, but SLOs are designed for teachers to ‘formally’ monitor what they are already doing in the classroom on a daily basis.”

Essentially, two SLOs are created by each teacher and administrator. (A third district SLO is drafted by the Office of Curriculum and Instruction for high school teachers who are responsible for Biology, English 10, Algebra I, Algebra II, and Government (HSSA) courses in the previous year.) Each SLO states the goal that teacher or administrator has for his or her students during the year. The results are a portion of the teacher’s final evaluation score. Student growth measures are 50% of teacher evaluations. For teachers who teach content areas with state assessment data, the SLOs are 30% of the student growth measures while for teachers without state assessment data, the SLOs are 35% of their final evaluations score.

Continue reading

Notes on 2017 PARCC Results

by Lori Morrow

Results for the PARCC Assessments taken in Spring 2017 were the main discussion item at the PGCPS Board of Education meeting on September 19, 2017.  PARCC stands for the Partnership for Assessment of Readiness for College and Careers. It is a set of annual tests in English/Language Arts and Mathematics that students take in grades 3-12 during April and May.  More information about PARCC can be found online at https://parcc.pearson.com or www.pgcps.org/parcc.

  • The Maryland State Department of Education released this year’s PARCC scores near the end of August 2017.  Results for all state, county and individual school results are available online at http://reportcard.msde.maryland.gov.
  • All students who took PARCC tests should receive individual score sheets from their schools.  If you have not received your results, contact your school’s Testing Coordinator.  Information about understanding the score sheets is online at www.pgcps.org/parcc. Dr. Goldson mentioned that PGCPS will not be presenting “PARCC Nights” like previous years due to low attendance during the 2016-17 School Year.

PARCC RESULTS PRESENTATION:

Dr. Goldson’s presentation begins with the overview and Elementary School Scores: https://youtu.be/o9T65Q9I83U?list=PL4585E4C6234DE895&t=1620

  • Grades 3-5: Increases in all ELA/Math scores by grade except for a decrease for Math 5. Despite increases, PGCPS is still well below the state average for both assessments. For all demographics, students did better on ELA than they did for Math. Most demographic subgroups showed improvement from SY2016 to SY2017.

Middle School Scores: https://youtu.be/o9T65Q9I83U?list=PL4585E4C6234DE895&t=1944

  • Grades 6-8: Slight decrease for student performance in grades 6-8 on both ELA and Mathematics assessments.  The only increase in results was at Grade 7, which was due to clarification from MSDE that students should take the assessment for their grade level.  All demographic subgroups did better on ELA assessments than they did in Math.  Asian and white students outperformed African American students, but it also must be noted that the number of African American students in PGCPS significantly exceeds the number of Asian and white students.  Most groups at the middle school level showed minimal growth or a slight decrease.

Continue reading

SAT Scores Continue Decline, ACT Scores Increase

by Genevieve Demos Kelley

According to the Maryland Report Card, the 2016 mean composite SAT score for Prince George’s County high schools is ten points lower than it was in 2015, representing the eighth straight year of decline. Since 2008 — the earliest year for which data is available — the mean composite score has dropped by nearly 100 points, from 1282 to 1185. The composite score includes a math, critical reading, and writing component*; the maximum score is 2400. The school system’s mean math subscore was 392 in 2016, compared with 397 the previous year. The mean 2016 critical reading and writing subscores were 403 and 390 respectively, compared with 405 and 393 in 2015.

One possible explanation for the decline is that the number of test takers was slightly higher compared with the year before (6,669 vs. 6,630 in 2015), though the cohort of seniors appears to be smaller, based on Maryland Report Card data.

While SAT scores have been declining since 2008, ACT scores in the county have been inching up. The mean composite score in 2016 was 19, compared with 18 in 2015, and 17, in 2008. (The maximum ACT score is 36.) While the number of PGCPS students taking the ACT has increased significantly (1,183 in 2016 compared with 871 in 2008), it is still much smaller than the number of students taking the SAT. It is interesting to note that an ACT score of 19 puts a test taker at about the 44th percentile, compared with students nationwide, making PGCPS’s ACT performance look respectable, if not impressive. (Looking at PGCPS’s SAT scores in the context of national benchmarks and percentile ranks presents a much bleaker picture.)

The table below shows the average reading, math, and writing subscores and the average composite SAT scores for 2016 college bound seniors in each of the county’s public high schools, as well as the average scores for PGCPS and the state of Maryland. Next to each score, the change from the previous year, 2015, is displayed in either red or green. (For example, at the Academy of Health Sciences, the average reading SAT score was 542 in 2016, eight points higher than it was in 2015.)

SAT_table

Mean SAT scores for college-bound seniors, as reported by the MSDE on the 2016 Maryland Report Card; changes (+/-) from 2015.

Continue reading

A Closer Look at 7th Grade Math PARCC Scores

by Lori Morrow

Over the next two months, PGCPS will administer the Partnership for Assessment of Readiness for College and Careers (PARCC) test for the third year. For more about PARCC visit the PGCPS website at http://www1.pgcps.org/parcc/.

In late September 2016, PGCPS announced that students had made gains on the PARCC test at most grade levels. However, there was an exception for seventh grade, my child’s grade. According to a PGCPS press release, “Overall, the percentage of students who met or exceeded expectations was higher this year, with the exception of the seventh-grade math test, whose testing pool excluded higher-performing students enrolled in eighth-grade math or Algebra I.”

I had initially missed the note about this “exception” but began to look closer at PARCC scores on the Maryland State Department of Education (MSDE) Maryland Report Card after receiving my son’s individual score sheet in October. I was surprised to see so few Level 4 or Level 5 scores for the Math 7 test; those blocks were labeled only with an asterisk, indicating less than 5%. Why had this cohort—students who took the MSA in fifth grade and started with PARCC in sixth grade—fallen behind?

In an email response, PGCPS CEO Dr. Kevin Maxwell said that the apparent drop for the Math 7 scores was due to a change in the testing pool. He explained that in the spring of 2015, seventh-grade students, regardless of their math class, took the PARCC score aligned with their grade, Math 7. However, in 2016, PGCPS chose to have seventh-grade students enrolled in Honors Math/Accelerated 2 take the Math 8 PARCC exam, since the accelerated course curriculum was designed to cover Math 7 and 8. This is a question that I never thought to ask when I attended PARCC nights in the spring, but it made a difference in the score results.

On the MSDE website, it is not intuitive that some students are tested at a level other than their assigned grade before high school. Results are broken down by test level and demographics but not by student’s grade. Furthermore, my follow-up questions to PGCPS about the results of seventh graders alone were met with the answer that the information was not publicly available. I knew that my child’s score level had dropped from taking the Math 6 PARCC test in sixth grade to taking the Math 8 PARCC in seventh grade, but I wanted to know how the rest of the seventh graders in Honors/Accelerated 2 fared on the Math 8 exam. After filing a Maryland Public Information Act request, I received the results.

pgcps parcc2016 with mpia

Continue reading

Maryland Legislative Session: The Kindergarten Readiness Assessment

The following is a testimony given by Genevieve Demos Kelley at the Maryland House of Delegates Ways and Means Committee Public Hearing on February 18th, 2016, in support of House Bill 657, a bill that would limit the Kindergarten Readiness Assessment to a random sample of students. The views expressed are the author’s own and do not necessarily reflect the views of Prince George’s County Advocates for Better Schools.

Image 2-20-16 at 4.28 PMThank you for giving me the opportunity to speak in support of HB 657. I am a mother of two boys: a seven-year-old in the Prince George’s County school system and a four-year-old who is still in preschool.

My older son started kindergarten in the fall of 2013, one year before the Kindergarten Readiness Assessment was implemented statewide. I vividly remember the mix of anxiety and excitement that we both experienced as I took him to his classroom and then said goodbye. Of course I wanted him to learn to read and and to write, but most of all, I wanted him to learn to love learning, to learn to love school. And he did! He was fortunate to have a teacher who sparkled in the classroom. Her lessons were engaging, and she cared about her students. I was confident that my son was in good hands.

The next school year, as my son was adjusting to first grade, I kept hearing the same complaints from parents in my community whose kids had just entered kindergarten: Their children were underwhelmed, and they did not understand why the kindergarten teachers were so frequently absent.

Eventually, an article in the Washington Post and a quick google search led me to MSEA’s Report and Recommendations on the Kindergarten Readiness Assessment. I learned about the terrible disruption to the classroom that this new test was causing, as teachers were required to administer a one-on-one test to every child in their class. Hundreds of teachers had responded to MSEA’s survey, and I found pages and pages of heartbreaking comments from teachers — teachers who felt that they were no longer able to do their jobs effectively during the critical first few weeks of school.

Continue reading

Teachers Concerned about Time-Consuming Test for Kindergarteners

by Genevieve Demos Kelley

IMG_6404I have been a teacher in Maryland for over 33 years and I have never had anything impact my instruction negatively as the administration and recording of the KRA.  — from MSEA’s Survey of Kindergarten Teachers, (Appendix I, p. 34)

Maryland’s Kindergarten Readiness Assessment (KRA), introduced during the 2014-2015 school year, is designed to measure a child’s readiness for school in four areas: Language & Literacy, Mathematics, Physical Well-being & Motor Development, and Social Foundations.

On the surface, this sounds reasonable: Teachers have always assessed their incoming students’ skills, so that they can better meet the needs of the class. But the outcry from kindergarten teachers over this new assessment was so loud that the Maryland State Education Association (MSEA) asked that the use of the KRA be suspended until “critical revisions” are made. A 100-plus page report issued by MSEA documents survey data and narrative responses from hundreds of kindergarten teachers.

The feedback has been overwhelmingly negative. Teachers are deeply concerned about the loss of instructional time, and they see little value in the data generated by the test.

  • The test is administered by the child’s kindergarten teacher — not an assistant or other staff member — on a one-on-one basis. Since the assessment occurs during the school day, instructional time is lost as teachers pull students for testing and substitutes take their place. Here are comments from three teachers who responded to MSEA’s survey:
    • The time used to administer the KRA…could be used to pull small groups, work one-on-one with students, provide enrichment to students, collect data for progress reports, etc. (p.2).
    • Some of the fun projects we do in the beginning of the year, that go along with the curriculum, have gone by the way side (Appendix I, p. 58).

    • The first few months of school are the most important in setting routines, expectations and getting to know my children. I have spent more hours ignoring their needs or handing off instruction to substitutes then I can count (Appendix I, p.1).
  • Initially, teachers were told that the test would take about 45 minutes for each child. But according to the Maryland State Education Association’s (MSEA) survey of kindergarten teachers, about 80% of teachers found that the test took more than hour to administer. Nearly one in five teachers (17.7%) reported that the test took over two hours. Multiplying this by the number of kindergarteners in each class means many hours of lost instruction.

Continue reading

PGCPS to Host Four PARCC Nights for Parents

With the Partnership for Assessment of Readiness for College and Careers (PARCC) test window opening on April 18th and closing on May 31st, many teachers are beginning to prepare their students. These computer-based assessments, introduced in the spring of 2015, are Maryland’s new accountability program and are designed to measure college and career readiness. Beginning in third grade, students in elementary, middle, and high school will take both Mathematics and English Language Arts (ELA) sections of the PARCC. Prince George’s County Public Schools (PGCPS) will involve parents in these preparations by hosting four parent nights in the upcoming weeks.

Each event will feature an address from a representative of the Maryland State Department of Education. PGCPS staff will explain the PARCC assessment, the student score reports, and current preparations happening in classrooms. This information will be followed by breakout sessions including topics pertaining to parents of Pre-K through high schools students as well as English Language Leaners and special education students.

Registration in advance is strongly encouraged. Parents may register here. (Language interpretation services will be provided in Spanish but registration is required for ASL or any other language.)

Locations and dates are as follows:

Continue reading

Prince George’s County PARCC Results Released for Elementary and Middle Schools

by Genevieve Demos Kelley

classroom
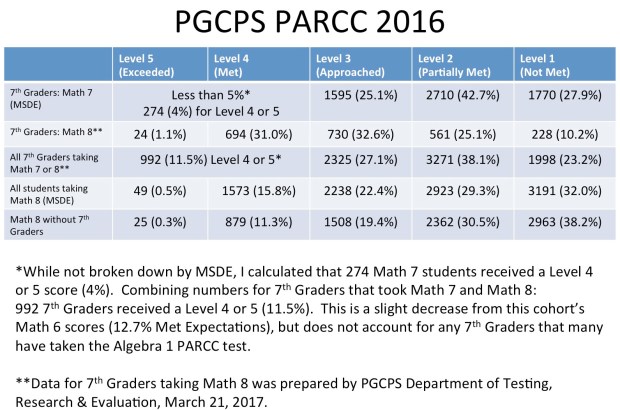
The elementary and middle school test results for the new Partnership for Assessment of Readiness for College and Careers (PARCC) in English Language Arts/ Literacy (ELA) and mathematics are now available on the Maryland State Department of Education’s Maryland Report Card. According to the PGCPS news release, home reports will be distributed next Monday.

Maryland is one of a shrinking number of states committed to using the new test, which was administered for the first time during the spring of the 2014-2015 school year.

Here are some key points from the data:

Fewer PGCPS Students Passed AP Exams in 2015

by Genevieve Demos Kelley

Earlier this year, we ran a story noting the six-year upward trend in Advanced Placement (AP) exam participation among students in Prince George’s County Schools. Between 2008 and 2014, participation in the AP program grew, while passing rates held steady. (Scores of three or higher, out of a possible five points, are considered passing.)

But according to numbers released on the 2015 Maryland Report Card, both the number of exams taken and the overall passing rate have declined slightly this year. Mathematics exams saw the biggest drop with a passing rate of 15.8% and 109 out of 692 exams receiving a passing score in 2015, compared with last year’s passing rate  of 19.1%, with 161 successful exams out of a total of 841 exams taken.

2008 2014 2015
AP Subject Description Exams with Scores 3-5/ Exams Taken
(%Exams w/ Scores 3-5)
Exams with Scores 3-5/ Exams Taken
(%Exams w/ Scores 3-5)
Exams with Scores 3-5/ Exams Taken
(%Exams w/ Scores 3-5)
All Subjects 2150/7829 (27.5%) 2606/9660 (27%) 2443/9452 (25.8%)
All Fine Arts 55/120 (45.8%) 130/267 (48.7%) 95/267 (35.6%)
All English Language Arts 593/2313 (25.6%) 623/2737 (22.8%) 625/2684 (23.3%)
All Foreign Language 191/301 (63.5%) 227/308  (73.7%) 183/251 (72.9%)
All Mathematics 180/753 (23.9%) 161/841  (19.1%) 109/692 (15.8%)
All Science 682/2341 (29.1%) 775/2791 (27.8%) 778/2616 (29.7%)
All Social Studies 449/2001 (22.4%) 690/2716 (25.4%) 618/2880 (21.5%)

Source: Maryland Report Card

These numbers don’t look good, but it’s not all bad news. Let’s take a closer look at the data and put the numbers in context: