by Genevieve Demos Kelley
According to the Maryland Report Card, the 2016 mean composite SAT score for Prince George’s County high schools is ten points lower than it was in 2015, representing the eighth straight year of decline. Since 2008 — the earliest year for which data is available — the mean composite score has dropped by nearly 100 points, from 1282 to 1185. The composite score includes a math, critical reading, and writing component*; the maximum score is 2400. The school system’s mean math subscore was 392 in 2016, compared with 397 the previous year. The mean 2016 critical reading and writing subscores were 403 and 390 respectively, compared with 405 and 393 in 2015.
One possible explanation for the decline is that the number of test takers was slightly higher compared with the year before (6,669 vs. 6,630 in 2015), though the cohort of seniors appears to be smaller, based on Maryland Report Card data.
While SAT scores have been declining since 2008, ACT scores in the county have been inching up. The mean composite score in 2016 was 19, compared with 18 in 2015, and 17, in 2008. (The maximum ACT score is 36.) While the number of PGCPS students taking the ACT has increased significantly (1,183 in 2016 compared with 871 in 2008), it is still much smaller than the number of students taking the SAT. It is interesting to note that an ACT score of 19 puts a test taker at about the 44th percentile, compared with students nationwide, making PGCPS’s ACT performance look respectable, if not impressive. (Looking at PGCPS’s SAT scores in the context of national benchmarks and percentile ranks presents a much bleaker picture.)
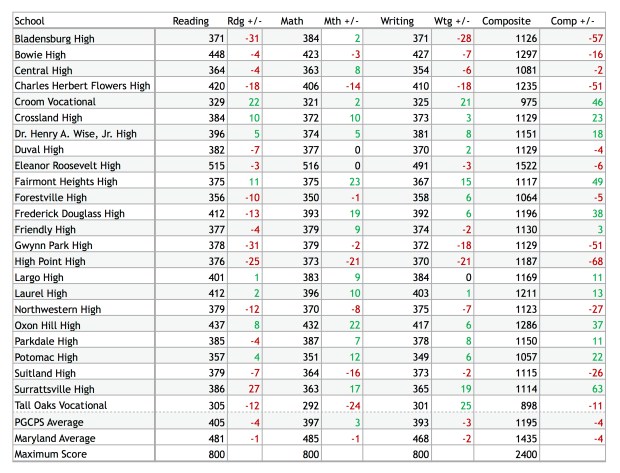
The table below shows the average reading, math, and writing subscores and the average composite SAT scores for 2016 college bound seniors in each of the county’s public high schools, as well as the average scores for PGCPS and the state of Maryland. Next to each score, the change from the previous year, 2015, is displayed in either red or green. (For example, at the Academy of Health Sciences, the average reading SAT score was 542 in 2016, eight points higher than it was in 2015.)
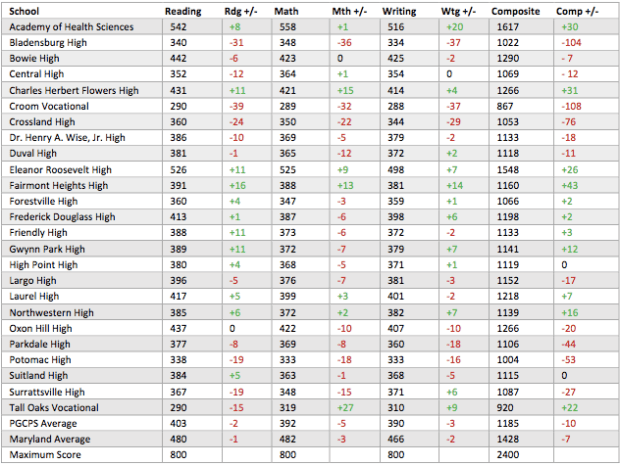
Mean SAT scores for college-bound seniors, as reported by the MSDE on the 2016 Maryland Report Card; changes (+/-) from 2015.