by Genevieve Demos Kelley
The recently released report on school size commissioned by the Maryland State Department of Education has suggested enrollment limits set at 1,700 students for high schools, 900 students for middle schools, and 700 students for elementary schools.
Ten of PGCPS’s high schools have enrollments exceeding 1,700 students. How do these high schools perform, compared with the system’s smaller schools? Is smaller really better?
In the table below, I compare key data on PGCPS high schools from the 2014 Maryland Report Card: 1) size of enrollment, 2) the percentage of 12th graders who have passed the state assessments*, 3) the graduation rate**, 4) the mean (average) composite SAT score for 12th graders, and 5) the percentage of students qualifying for free and reduced meals (FARMs).
All data is from 2014, the most recent year available, and I have excluded alternative, vocational, and evening schools. Schools are listed in descending order by size of enrollment, and those above the dotted red line have enrollments greater than the suggested limit.
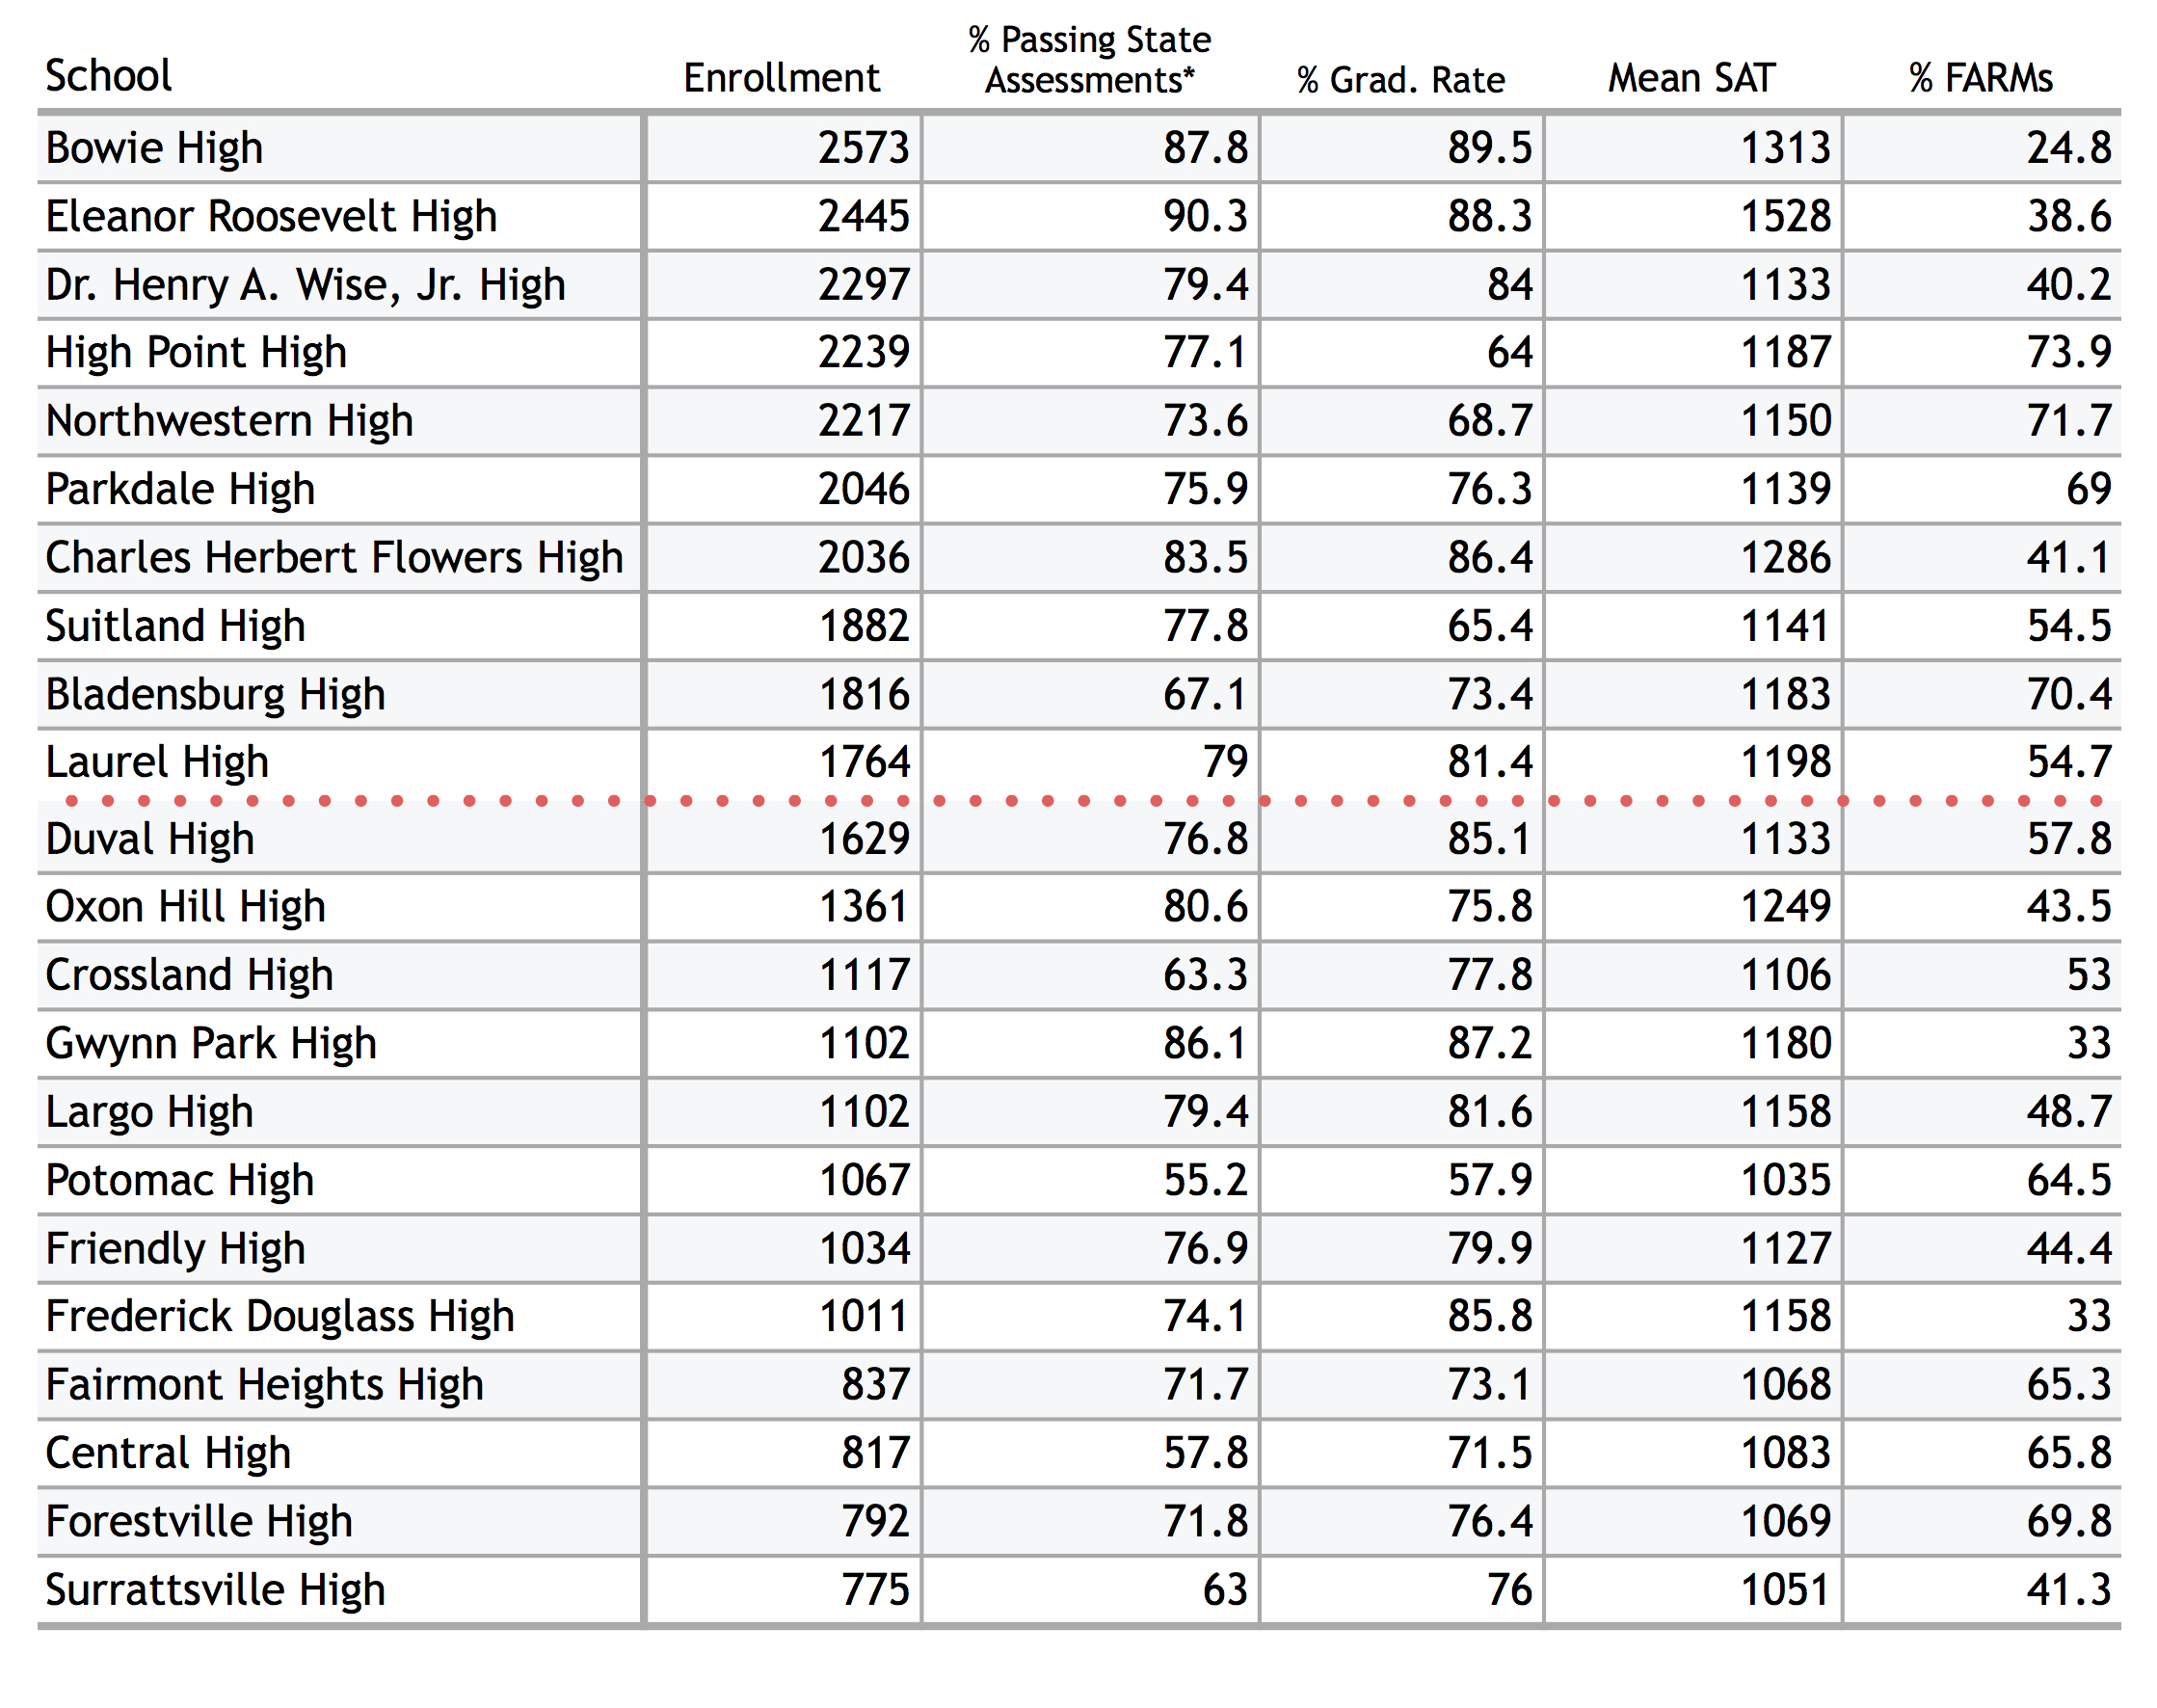 *The number here represents the percentage of 12th graders who took all state assessments and passed all tests or met the requirement by using the combined score option. More information here.
** The graduation rate given here is the rate for the 4-year adjusted cohort.
Having a hard time visualizing the data? Below is a scatter plot showing the percentage of 12th graders having passed state assessments vs. the number of students enrolled in the school. Each school is represented by a single point. Points farther to the right indicate larger schools; points higher on the figure indicate a higher passing rate. I have highlighted the schools with more than 1,700 students in red. In Prince George’s County, our large schools seem to be doing at least as well as our smaller schools on state assessments. 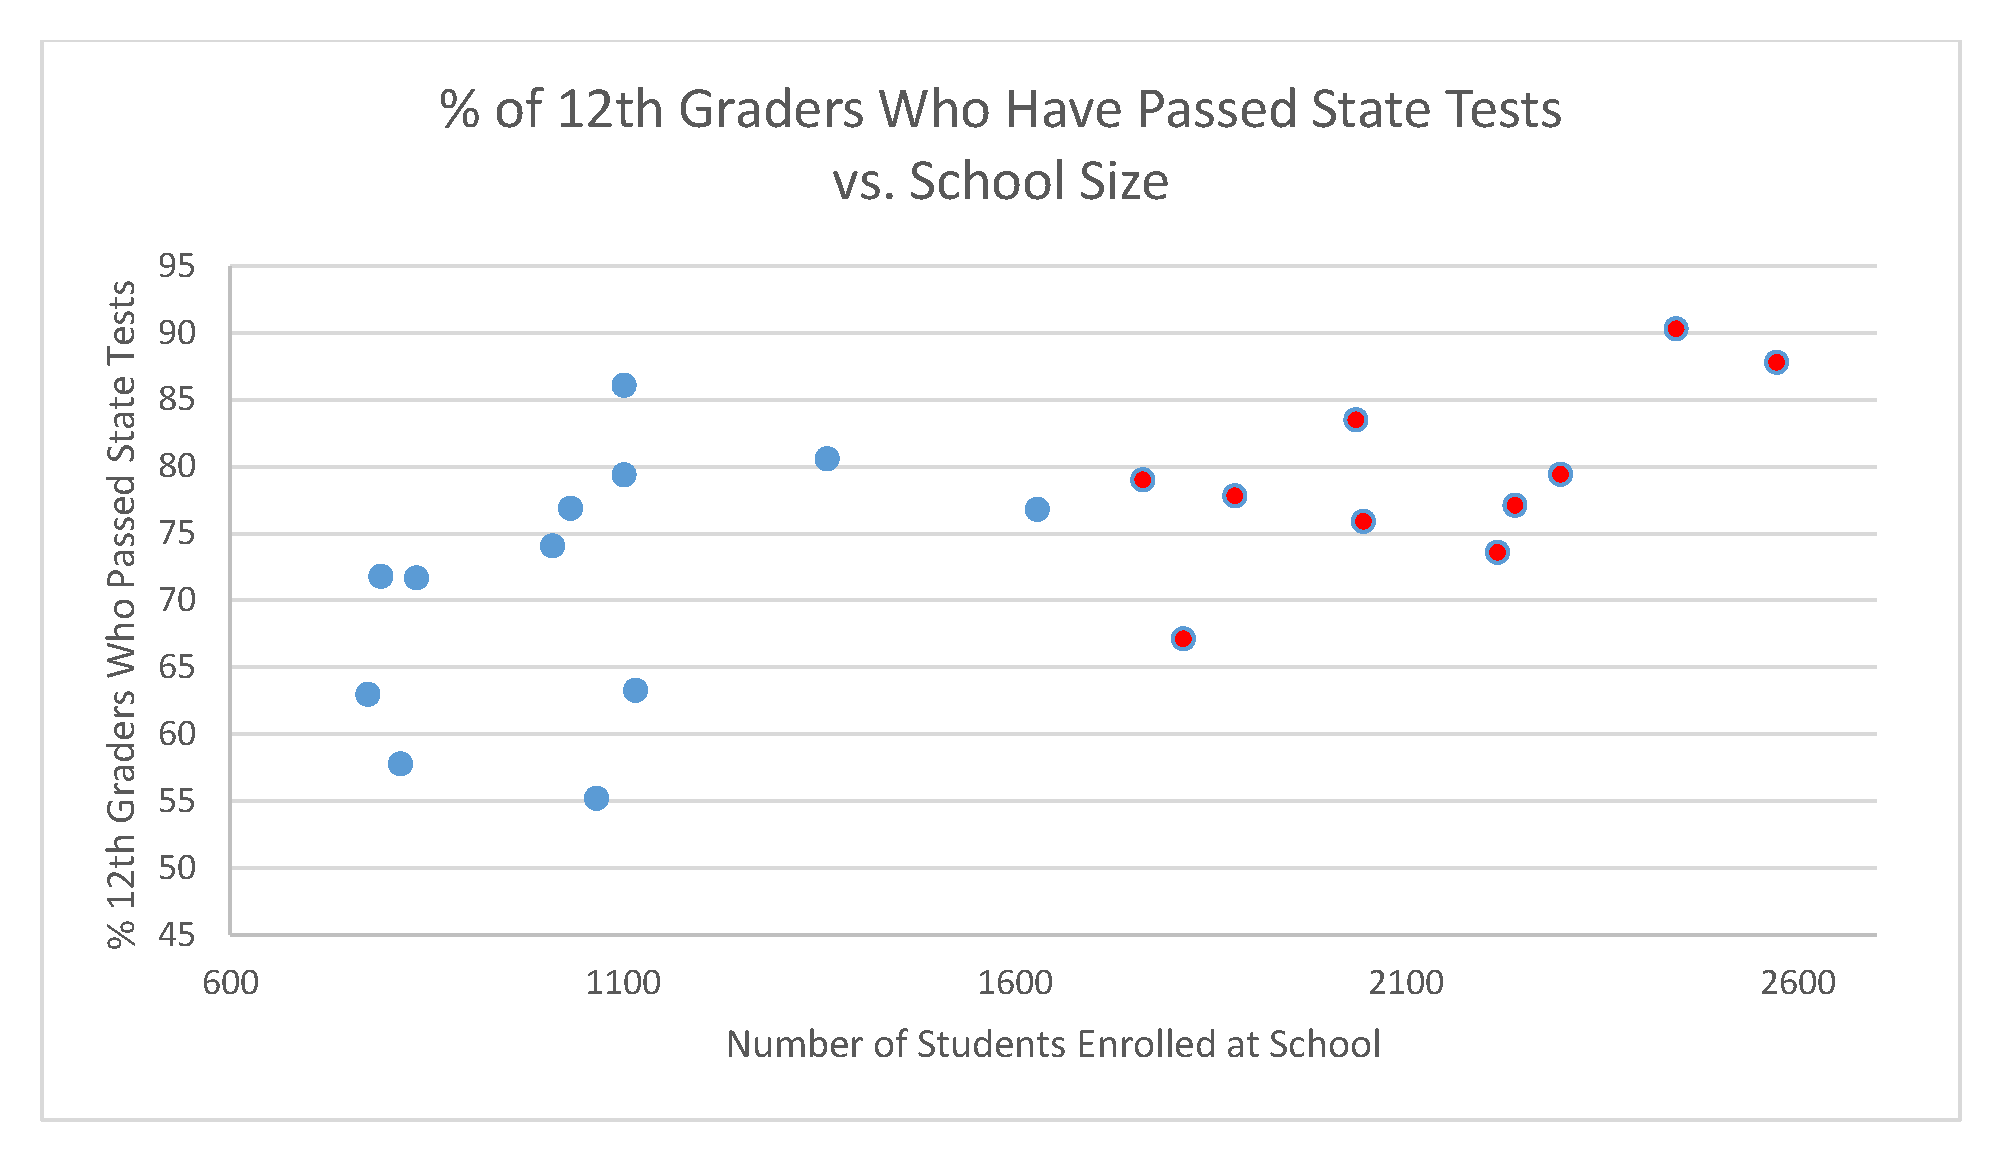
This is interesting data, but we must be careful not to draw conclusions about how school size affects student performance on state tests. These numbers don’t prove that large schools are more effective (or as effective) at educating students, compared with small schools: It’s likely that there are several factors not related to size (e.g. demographics, specialty programs) that contribute to the success of larger schools. This data also fails to take into account intangible benefits that are not measured by standardized tests.
Let’s look at how one quantifiable factor relates to performance on state tests: family income levels. The scatter plot below is meant to give us a sense of how students perform on standardized state assessments when percentages of low-income families are taken into account. Again, each school is represented by a single point, and schools with enrollments over 1,700 are highlighted in red.
This time, the horizontal axis represents the percentage of the student body qualifying for free and reduced meals (FARMs). The vertical axis represents the percentage of 12th graders who passed all state assessments or met the combined score option. So, the greater the percentage of students passing state tests, the higher the school appears on the chart. Points farther to the right indicate more FARMs qualifying kids; points toward the left indicate schools with lower FARMs rates.
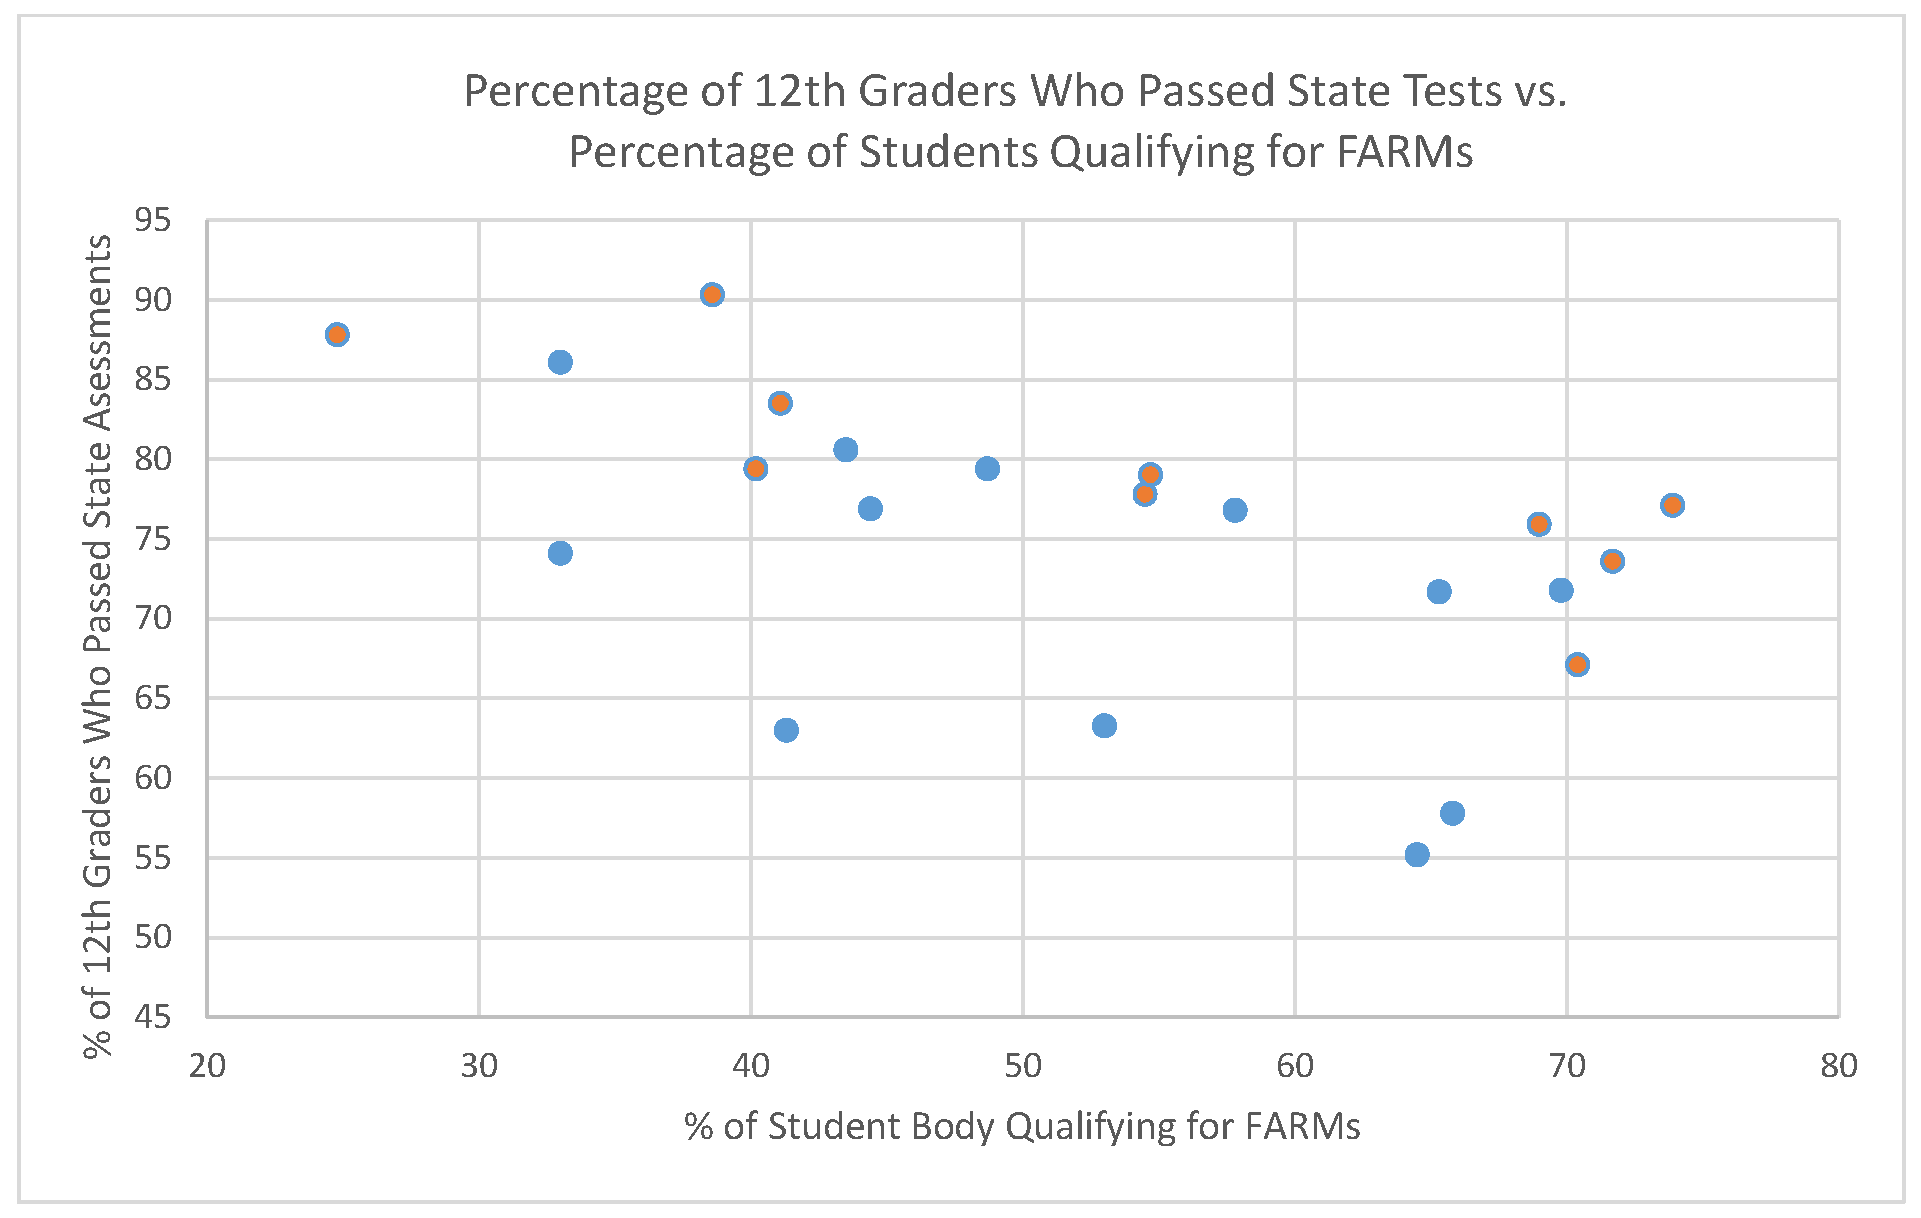
As you might expect, there appears to be a negative correlation between the two variables: The more FARMs qualifying students a school has, the less likely it is to have high passing rates on state assessments. But some schools are doing much better on state assessment, even compared with other schools that have similar FARMs percentages.
Again, the larger schools (i.e. more than 1,700 students) do not suffer in comparison with the smaller schools. But once again, it is important to use caution about interpreting data. Many other factors besides percentages of FARMs qualifying students affect a school’s performance on standardized tests. However, in light of the Maryland School Size Study’s recommendations, this is useful data on how our county high schools — large and small — measure up.
