Today is the last day to take the 2015 School Climate Survey. Parents received an email in June from the Department of Research and Evaluation with an invitation to participate in the survey and an individualized survey code. Parents cannot take the survey without the code, but students may use their student identification numbers and access the survey here.
The most recent survey, given in 2013, paints a picture of stakeholders’ satisfaction in several areas (called “subscales” in the analysis) such as relevant curriculum, safety and discipline, effective teaching, and amount of parental involvement that affect their schools’ overall climate. According to the Department of Research and Evaluation, as of 2013 a “substantial majority of the district’s key stakeholder groups has a positive perception of their schools’ climate.”
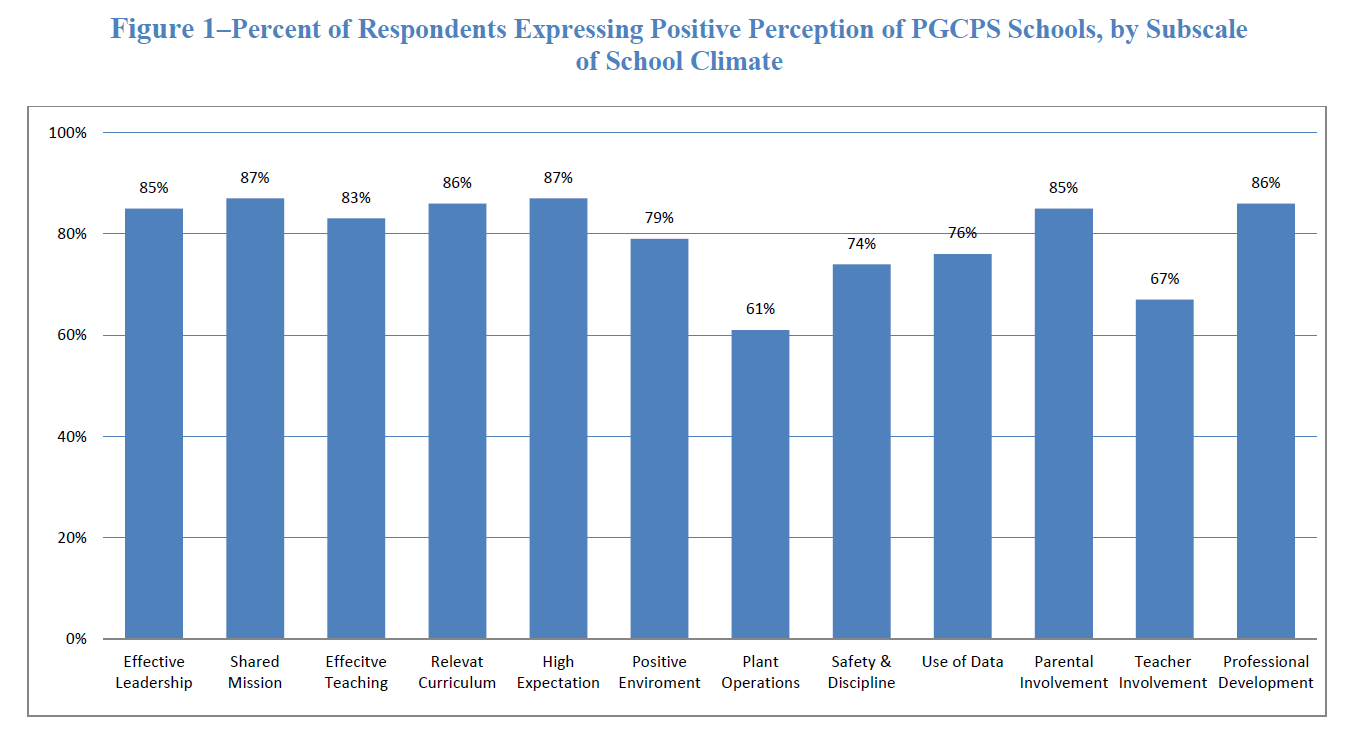
Source: PGCPS Dept. of Research and Evaluation, 2013
For students, “Effective Plant Operations” (i.e. facilities and equipment) was the area that was least favorably perceived, with only about half expressing a positive perception. (For example, at Greenbelt Elementary School, the single survey item that had the smallest percentage of favorable responses at 23.4% was, “The bathroom at my school is clean.”) In contrast, parents in the district, who spend less time in school buildings, had a much more favorable view of facilities, with 83% expressing a positive perception. About 64% of teachers expressed a positive perception.